Latitude vs. Humidity
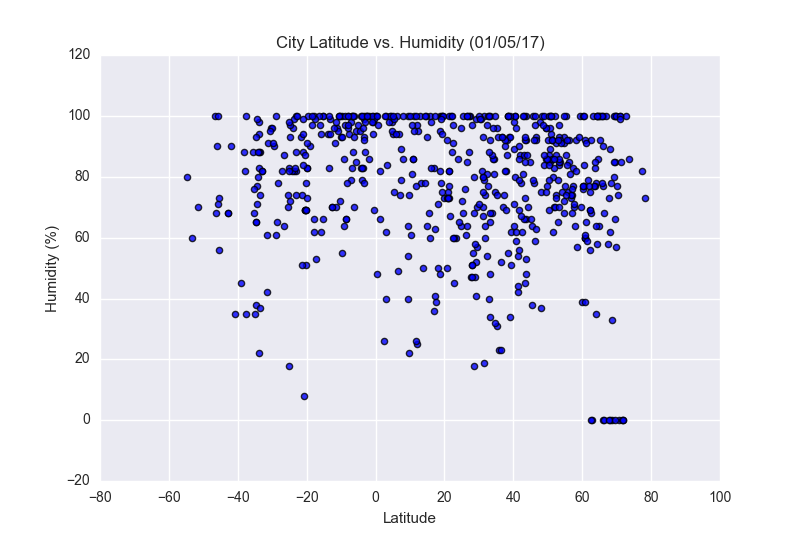
This chart tracks the relationship between latitude and the average recorded humidity in the
sample cities of this dataset. The y-axis displays the total percentage of humidity in the
sampled city, and as it can be readily seen most most cities sit well above the 50% line.
Likewise, there is very little trend in the data. While one can see that the cities thin around
the equator, it does not appear to a be a strong trend based on this chart.
It can be concluded that there is little to no relationship between latitude and humidty, considering
the seemingly random distribution of points across our scatter plot.