Latitude vs. Cloudiness
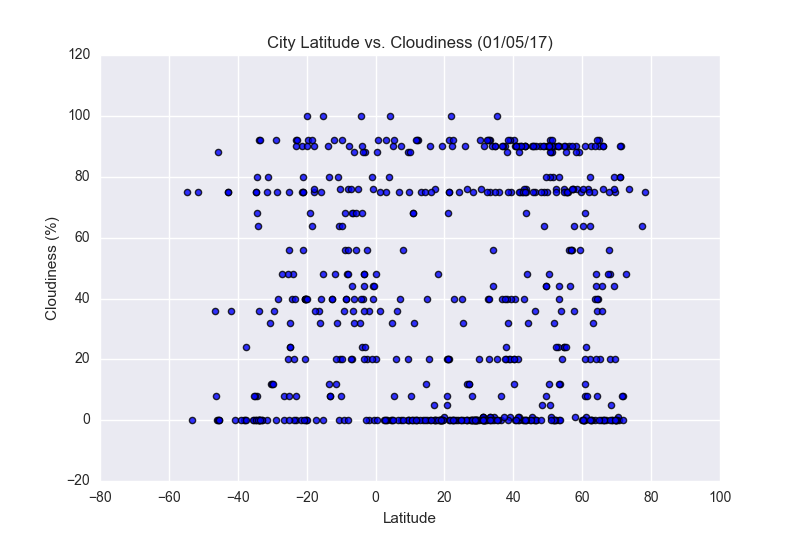
This chart displays the relationship between latitude and cloudiness, specifically the amount
of overhead cloud cover in the city in question. This metric is measured in a percentage, and
as it can be seen in the data, the method for collecting this data rounds it to flat number. This
unfortunately causes the data to appear uniform, and makes it difficult to determine a trend. One
can see that most cities tend towards the extremes, either 0% or 100%, but that there isn't much
to split higher versus lower latitude in terms of cloud cover. It seems randomly distributed,
and is thus most likely a weak, or nonexistant, relationship.
It would perhaps benefit this research to explore how data for cloud cover is recorded, so as to
account for its strange shape, or to potentially find a different dataset that has more comprehensive
and finely collected cloud cover data.